|
Intro:
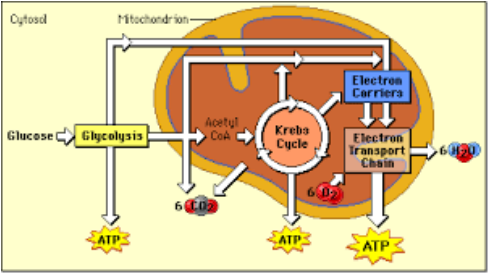
All life forms in earth depend on the sun for energy. Photosynthesis in plants traps energy from sun by formation of covalent bonds in complex organic compounds, such as glucose. Organisms release this stored energy by the breakdown of glucose. Energy released by the breakdown of glucose is stored in the high energy phosphate bonds of adenosine triphosphate, ATP. Each one produces about 36 ATP. Cellular respiration is the breakdown of organic compounds, resulting in the release of energy. The oxidative breakdown of glucose during cellular respiration produces the energy needed for life in living organisms, then this produces Carbon Dioxide. We will be using the gas law : PV = nRT P = the pressure of the gas R = the gas constant (a fixed value) V = the volume of the gas T = the temperature of the gas n = the number of molecules of the gas |

Objective:The main point of this lab is to measure the amount of oxygen by germinating and nongerminating peas and to determine how temperature affects the rate of cellular respiration.
|

Hypothesis:
|
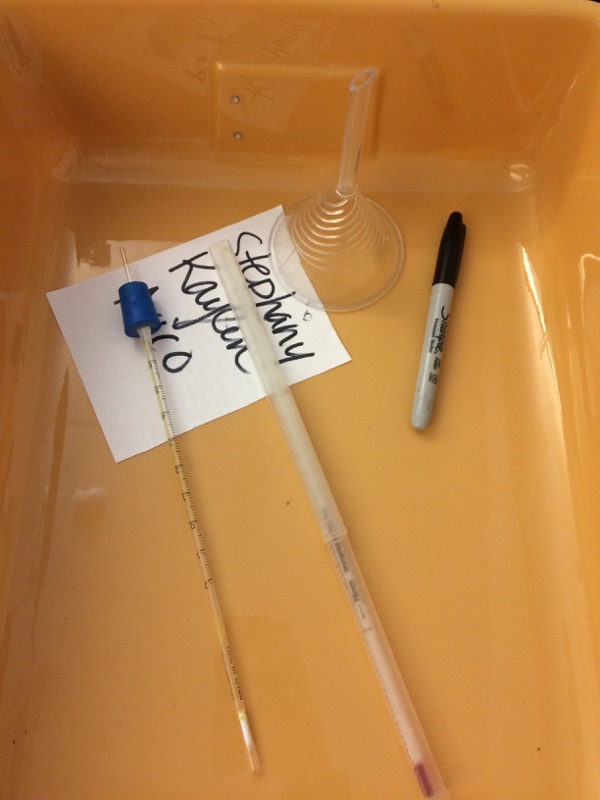
Materials:Notebook
3 Cork/pipet assemblies 3 Vials Absorbent cotton KOH solution Nonabsorbent cotton 100 ml graduated cylinder 25 non-germinated peas Small weights to hold vials in water Glass beads Tape Thermometer 25 germinated peas Tray Silicone glue Timer Parafi lm® |
Procedures:
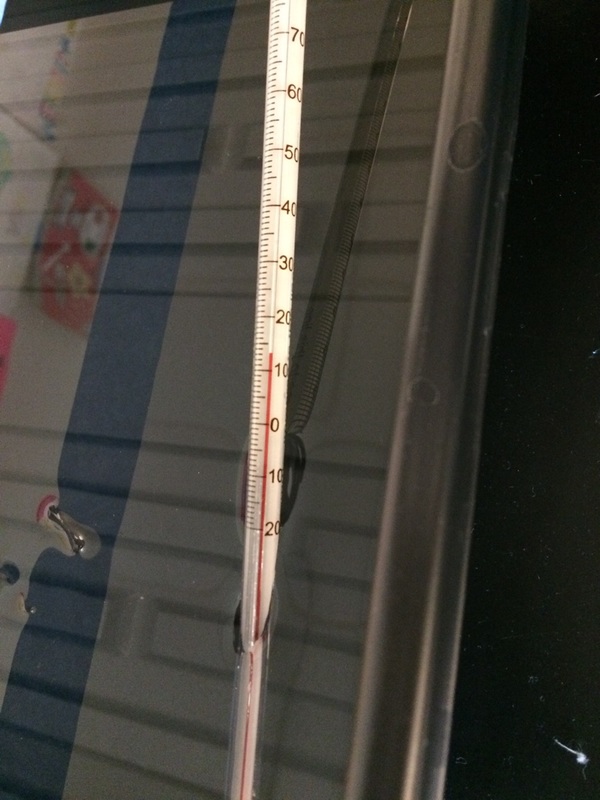
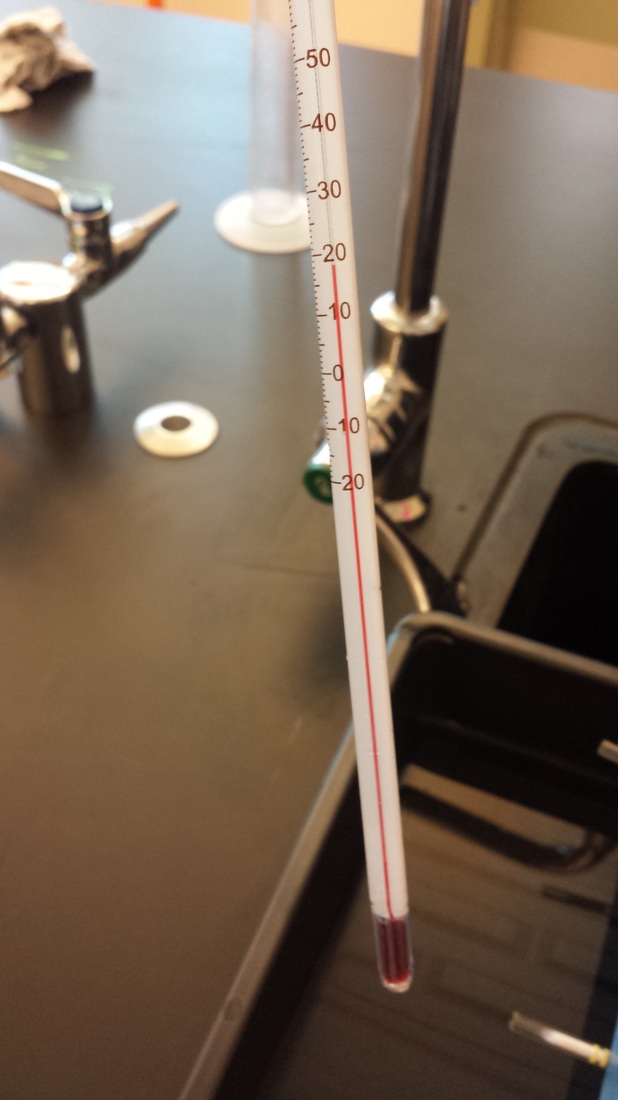
1. Set up a room temp. bath at 24'C
2.Label 6 vilas (A,B,C,D,E,F)
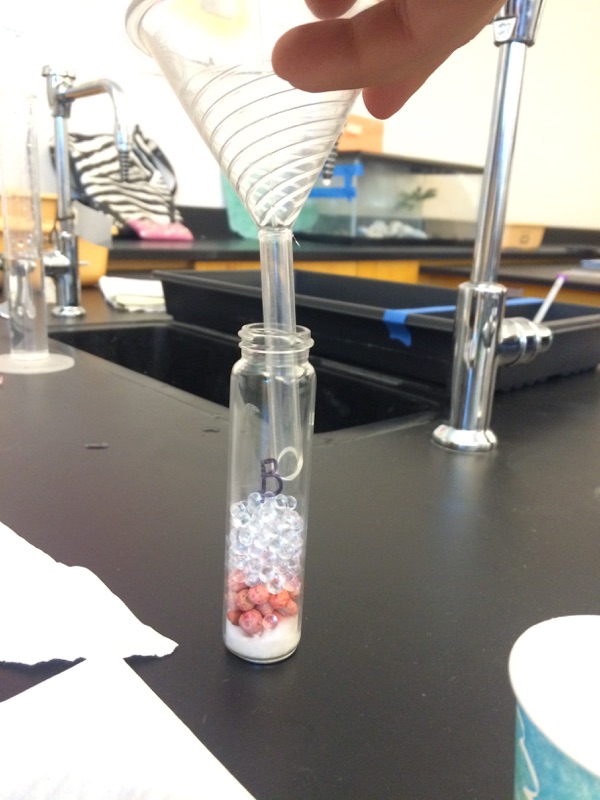
3. Place absorbent cotton (approximately the size of a nickel) into the
bottom of each vial.
• Carefully soak with 1- 2 ml of 15% KOH solution, not allowing any KOH solu-
tion to touch the side walls of the vials.
• Place a circle of nonabsorbent cotton into the vials directly on top of the KOH/cotton circle in the vial.
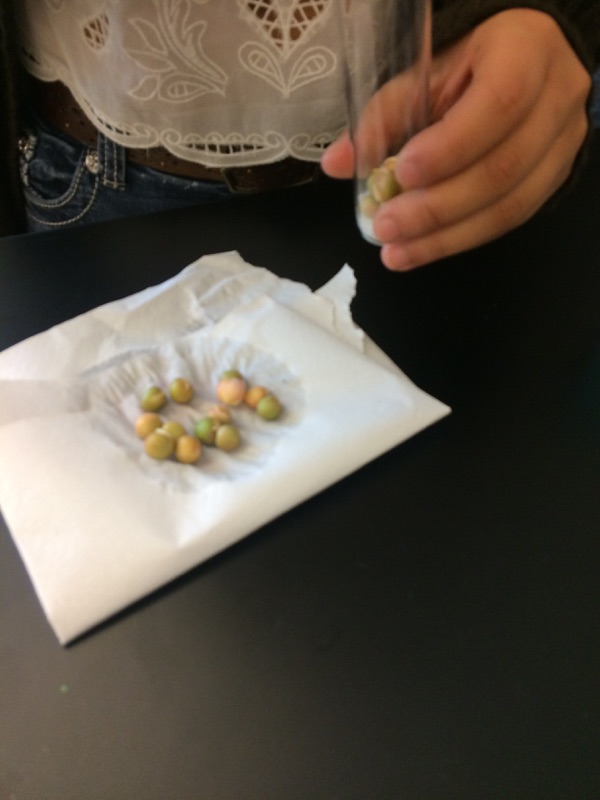
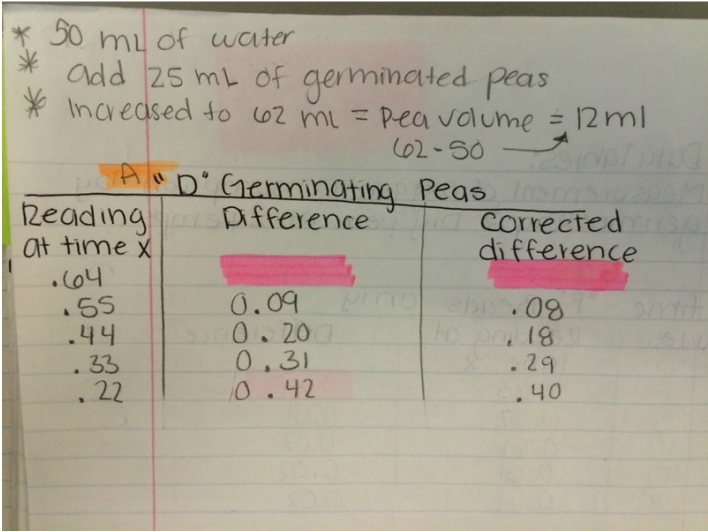
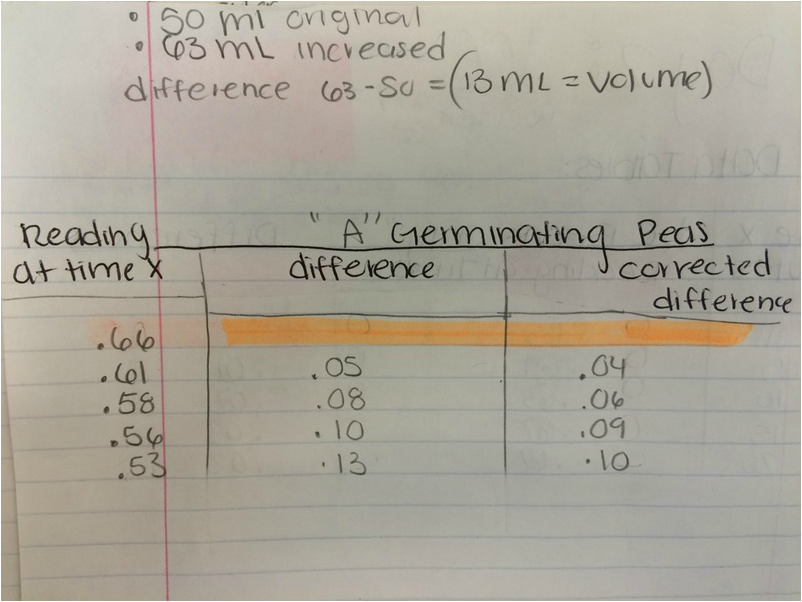
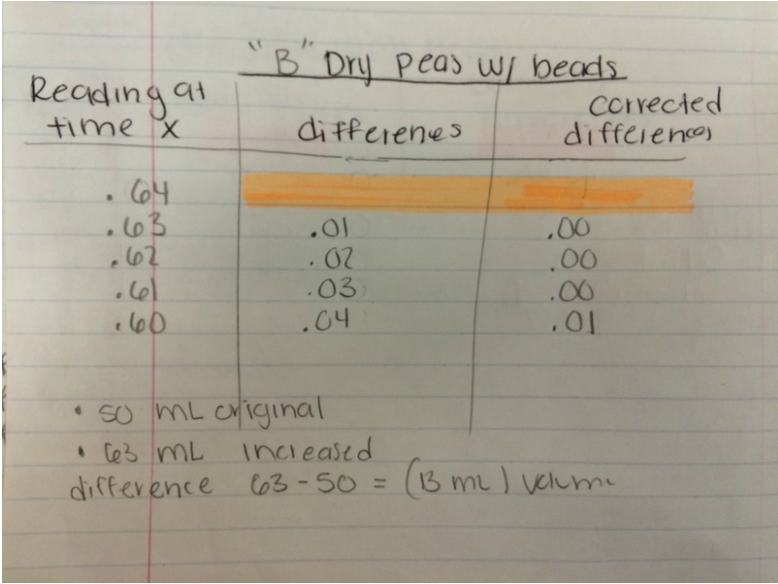
4. Determine the volume of germinated peas.
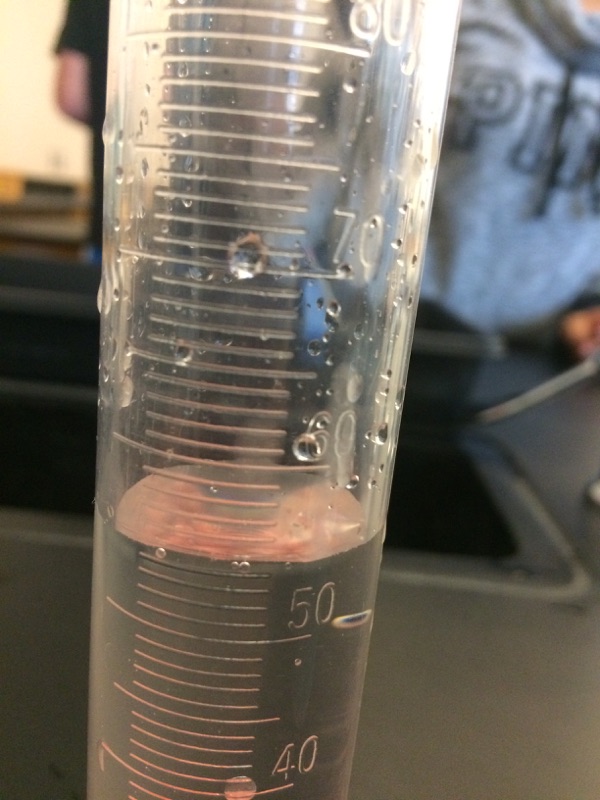
• Fill a 100 ml graduated cylinder with 50 ml of water.
• Add 25 germinated peas to the cylinder and measure the increase in water volume. The difference represents the volume of the peas.
Pea volume = __________ ml.
• Place the peas on a paper towel. These germinated peas will be used in Vial A.
• Repeat steps for Vial D.
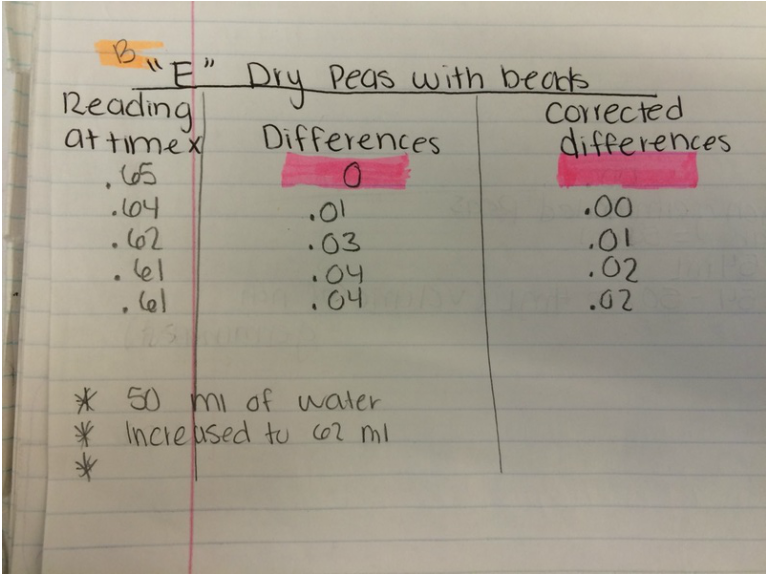
5. Determine the volume of non-germinated peas.
• Fill a 100 ml graduated cylinder with 50 ml water.
• Add 25 non-germinating peas.
• Add glass beads to raise the volume to equal that obtained with swollen ger-
minated peas.
• Remove the peas and beads. Place them on a paper towel. The non-germinat-
ed peas and beads will be used in respirometer B.
• Repeat steps for Vial E.
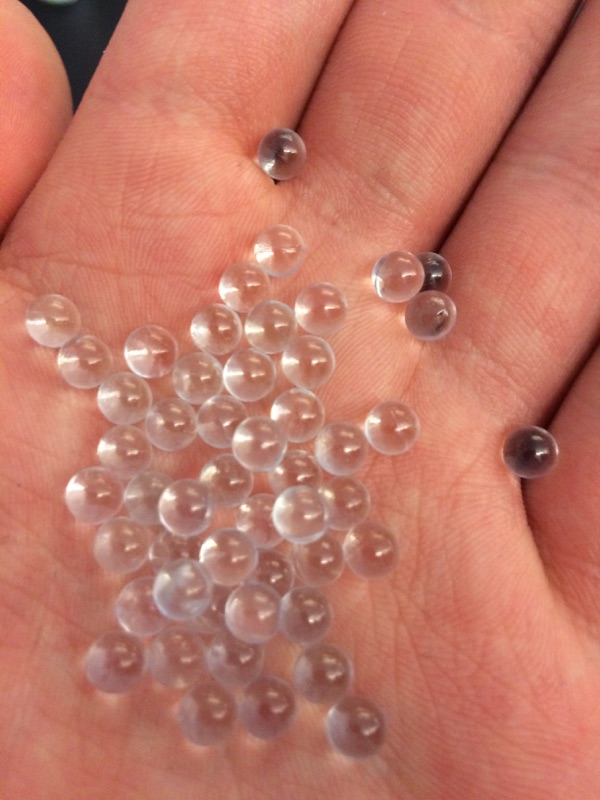
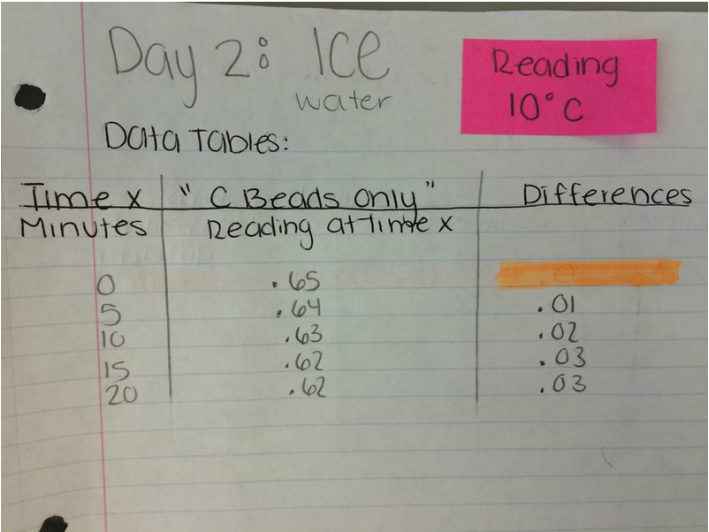
6. Determine the volume of glass beads.
• Fill the 100 ml graduated cylinder with 50 ml water.
• Add glass beads to raise the volume so it equals the volume of germinating
peas as determined previously in Step 3.
• Place glass beads on a paper towel, to be used in Vial C.
• Repeat steps for Vial F.
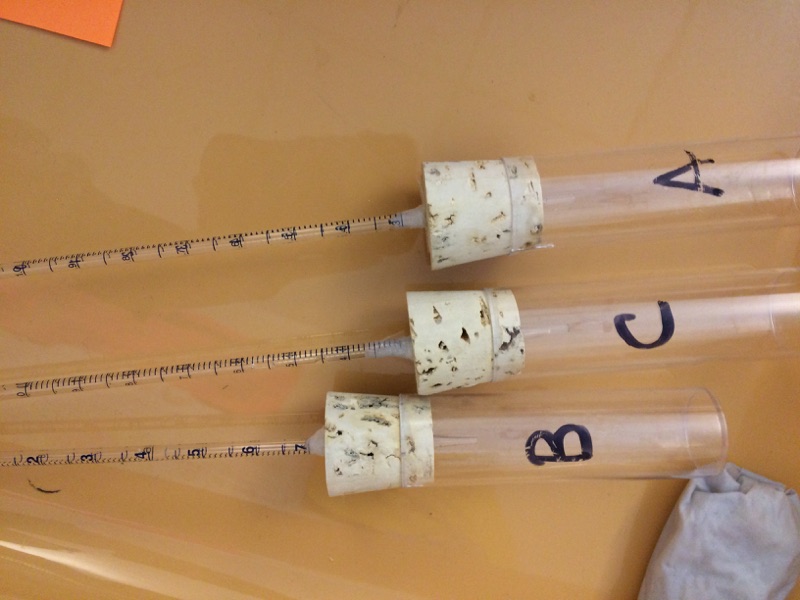
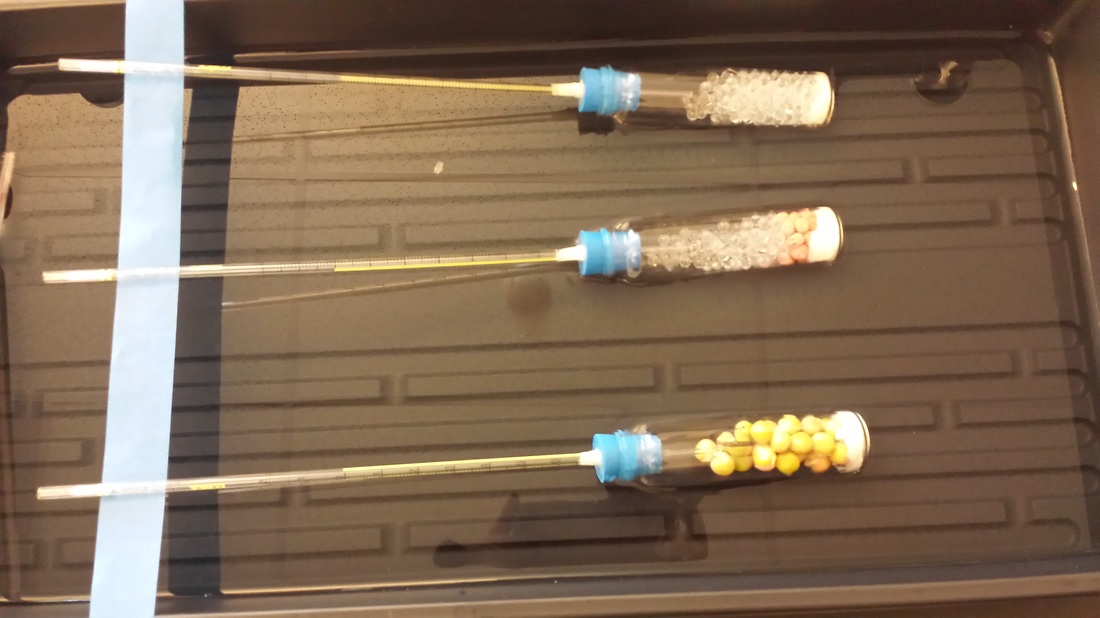
7. Place one set of germinating peas into Vial A. Insert the cork/pipet assembly into the
vial. Repeat with the second set of germinating peas for Vial D.
8. Place one set of non-germinated peas + glass beads into Vial B. Insert the cork/pipet
assembly into the vial. Repeat with the second set of non-germinated peas + glass
beads for Vial E.
9. Place one set of glass beads into Vial C. Insert the cork/pipet assembly into the vial.
Repeat with the second set of glass beads for Vial F.
10. Wrap Parafi lm® or plastic wrap tightlyaround the seams (cork and tube) to
seal any potential leak.
11. Make sure the ice water bath has equilibrated to 10° C. Record the temperature of the
room temperature bath.
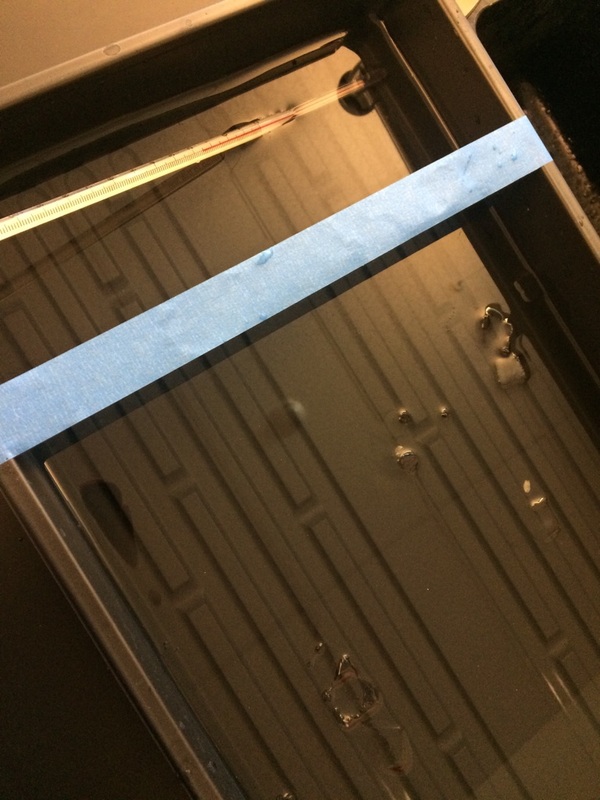
12. Place a piece of masking or lab tape over the water bath to suspend pipet
tips out of the water during the equilibration phase.
13. Place Vials A, B & C into the 10° C water bath and Vials D, E & F into the 24° C waterbath.
Place them with the calibrated side of the pipet facing up to allow measurements to be taken.
14. Allow the respirometers to equilibrate in the water baths for 8 minutes.
15. After the equilibration phase, immediately submerge each respirometer.
Make sure the vials do not fi ll up with water. If it does, there is a leak which
must be corrected.
16. Record the starting temperature. Maintain temperature by adding ice.
17. Record the starting point (“Time 0”) volume of each pipet.
Take readings of the volume of water in each pipet every 5 minutes for 20 minutes.
Record these values in the tables on the following page.
18. Collect class data for Vials A, B, C, D, E and F for both temperature water baths.
19. Correct volumes measured for changes in environmental variables.
2.Label 6 vilas (A,B,C,D,E,F)
3. Place absorbent cotton (approximately the size of a nickel) into the
bottom of each vial.
• Carefully soak with 1- 2 ml of 15% KOH solution, not allowing any KOH solu-
tion to touch the side walls of the vials.
• Place a circle of nonabsorbent cotton into the vials directly on top of the KOH/cotton circle in the vial.
4. Determine the volume of germinated peas.
• Fill a 100 ml graduated cylinder with 50 ml of water.
• Add 25 germinated peas to the cylinder and measure the increase in water volume. The difference represents the volume of the peas.
Pea volume = __________ ml.
• Place the peas on a paper towel. These germinated peas will be used in Vial A.
• Repeat steps for Vial D.
5. Determine the volume of non-germinated peas.
• Fill a 100 ml graduated cylinder with 50 ml water.
• Add 25 non-germinating peas.
• Add glass beads to raise the volume to equal that obtained with swollen ger-
minated peas.
• Remove the peas and beads. Place them on a paper towel. The non-germinat-
ed peas and beads will be used in respirometer B.
• Repeat steps for Vial E.
6. Determine the volume of glass beads.
• Fill the 100 ml graduated cylinder with 50 ml water.
• Add glass beads to raise the volume so it equals the volume of germinating
peas as determined previously in Step 3.
• Place glass beads on a paper towel, to be used in Vial C.
• Repeat steps for Vial F.
7. Place one set of germinating peas into Vial A. Insert the cork/pipet assembly into the
vial. Repeat with the second set of germinating peas for Vial D.
8. Place one set of non-germinated peas + glass beads into Vial B. Insert the cork/pipet
assembly into the vial. Repeat with the second set of non-germinated peas + glass
beads for Vial E.
9. Place one set of glass beads into Vial C. Insert the cork/pipet assembly into the vial.
Repeat with the second set of glass beads for Vial F.
10. Wrap Parafi lm® or plastic wrap tightlyaround the seams (cork and tube) to
seal any potential leak.
11. Make sure the ice water bath has equilibrated to 10° C. Record the temperature of the
room temperature bath.
12. Place a piece of masking or lab tape over the water bath to suspend pipet
tips out of the water during the equilibration phase.
13. Place Vials A, B & C into the 10° C water bath and Vials D, E & F into the 24° C waterbath.
Place them with the calibrated side of the pipet facing up to allow measurements to be taken.
14. Allow the respirometers to equilibrate in the water baths for 8 minutes.
15. After the equilibration phase, immediately submerge each respirometer.
Make sure the vials do not fi ll up with water. If it does, there is a leak which
must be corrected.
16. Record the starting temperature. Maintain temperature by adding ice.
17. Record the starting point (“Time 0”) volume of each pipet.
Take readings of the volume of water in each pipet every 5 minutes for 20 minutes.
Record these values in the tables on the following page.
18. Collect class data for Vials A, B, C, D, E and F for both temperature water baths.
19. Correct volumes measured for changes in environmental variables.
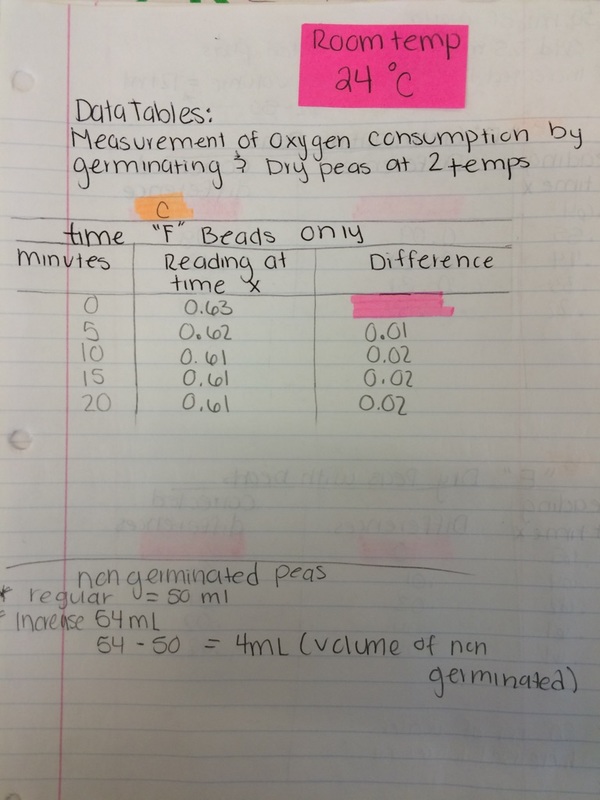
Data Tables & Volume:
Day 1; Room Temp 24'C
Date Tables & Volume(same):
Day 2; ice bath 10'C
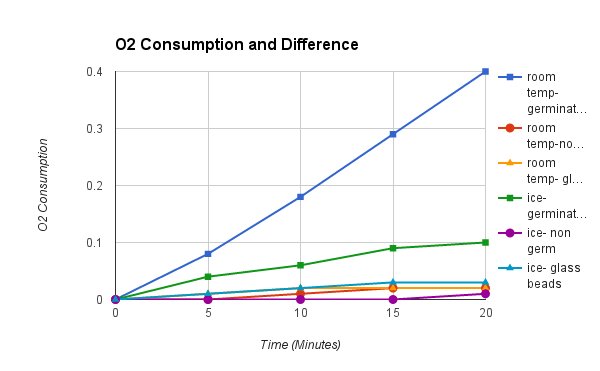
Graph: All viles |
|
Graph Justification:
This graph shows the amount of oxygen consumption between differen temperatures and amoung different kind of peas/beads. We found that the germinating peas were the most successful and when we placed our data into our graphs we could easily tell how successful the germinating peas were to the others in oxygen consumption total and increase in time. The lower the temperature, the slower and decrease amount of oxygen. The glass beads were the least successful due to their non-living characteristic which is why they did not consume a large amount of oxygen.
This graph shows the amount of oxygen consumption between differen temperatures and amoung different kind of peas/beads. We found that the germinating peas were the most successful and when we placed our data into our graphs we could easily tell how successful the germinating peas were to the others in oxygen consumption total and increase in time. The lower the temperature, the slower and decrease amount of oxygen. The glass beads were the least successful due to their non-living characteristic which is why they did not consume a large amount of oxygen.
|
Questions: 2.What accounts for the difference in oxygen consumption seen between the germi- nating and non-germinating seeds? The difference is since the germinating oeas are sprouting or "growing" they require more energy as they are going through this process to go through photosynthesis and this requires the use of more oxygen consumption than the non-germinating peas. 3. List some of the constant controls in this experiment. Some of the constant controls are the volume, all peas and glass beads had to have the same volume. Also the KOH used in each vial had to be equal as they go through cellular respiration. 4. Why do the glass beads seem to be using oxygen? Glass beads seem to be using energy due to the presence of carbon dioxide and it slowly being absorbed so that is why it seems that the glass beeds are resprirating. This is why we had a corrected difference for the glass beads. 5. Why are the readings corrected using the glass bead values? When using the glass beads the readings are corrected because they are glass. They do not breathe in oxygen, they do not respirate like the other peas. They are nonliving. 6. What is the function of KOH in this experiment? KOH is observing small amounts of carbon dioxide in this experiment in the glass beads. 7. Germinating and Non- germ slope:From the slope of the lines, determine the rate of oxygen consumption at 10°room temperature for the germinating and non-germinating pea seeds. 8. Compare the rate of oxygen consumption at 10°they different? The rate of oxygen at 10'C is much less compared to the consumption of oxygen at 24'C. The rate is much slower at 10'C due to the cold temperature, this slows does the process of cellular respiration. 9. How do you think the rates of respiration would change in peas that have been ger- minating for 0, 24, 48, 72, and 96 hours. Why? The peas that have been germinating for the longest time will have the highest rate of respiration. On the other hand, the non-germinating peas will have the lowest and slowest. 10. Write a hypothesis using the same experimental design to compare the rates of res- piration in a mouse at both room temperature 24° C and at 10° C. If the mouse is placed in cold habitat under temperatures of 10 degree C then the rate of respiration of the mouse will decrease because of the amount of oxygen consumption is slowed down. 11. Using the same experimental design, write a hypothesis to test the respiration rate of a 15 g reptile and a 15 g mammal at 10° C. If type of animal and how it maintains its normal body temperature plays important factors in differences in respiration than the mammal will consume more oxyen than the small reptile due to reptiles lacking in functioning in low temperatures. 12. What basic cellular process is responsible for the oxygen consumption? Cellular respiration. |
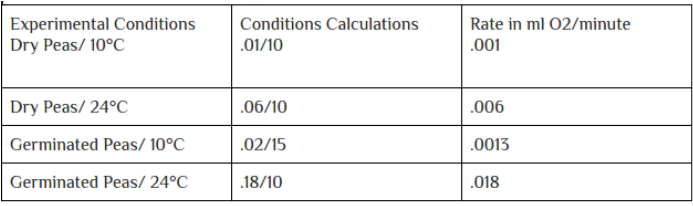
7. Germinating and Non- germ slope:From the slope of the lines, determine the rate of oxygen consumption at 10°room temperature for the germinating and non-germinating pea seeds.
|
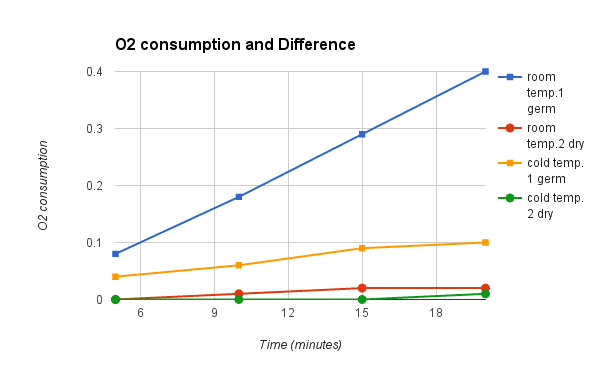
Graph: Germinating & Non-germinating |
|
Graph Justification:
This graph shows the comparison between germinating and non-germinating peas at both temperatures. The graph shows how both germinating peas at high or low temperature were much more successful in oxygen consumption and high rate. To add to this, even the germinating peas at cold temperature is still greater than the non-germinating peas at high temperature. Since the germinating peas are growing and need more energy their molecules increase faster allowing for respiration to occur more effectively.
independent variable is the time because it is constanly changing and will not stop
dependent variable is oxygen because it does not change it just depends on how much they actually consume.
Two hypothesis being tested is
- if the type of peas/beads will be a boost for oxygen consumption
-If the temperature of where the beads/peas are placed will increase or decrease the rate of oxygen in cellular respiration
